

sur CREDIT AGRICOLE SUD RHONE ALPES (EPA:CRSU)
Financial results of Crédit Agricole Sud Rhône Alpes as of June 30, 2026
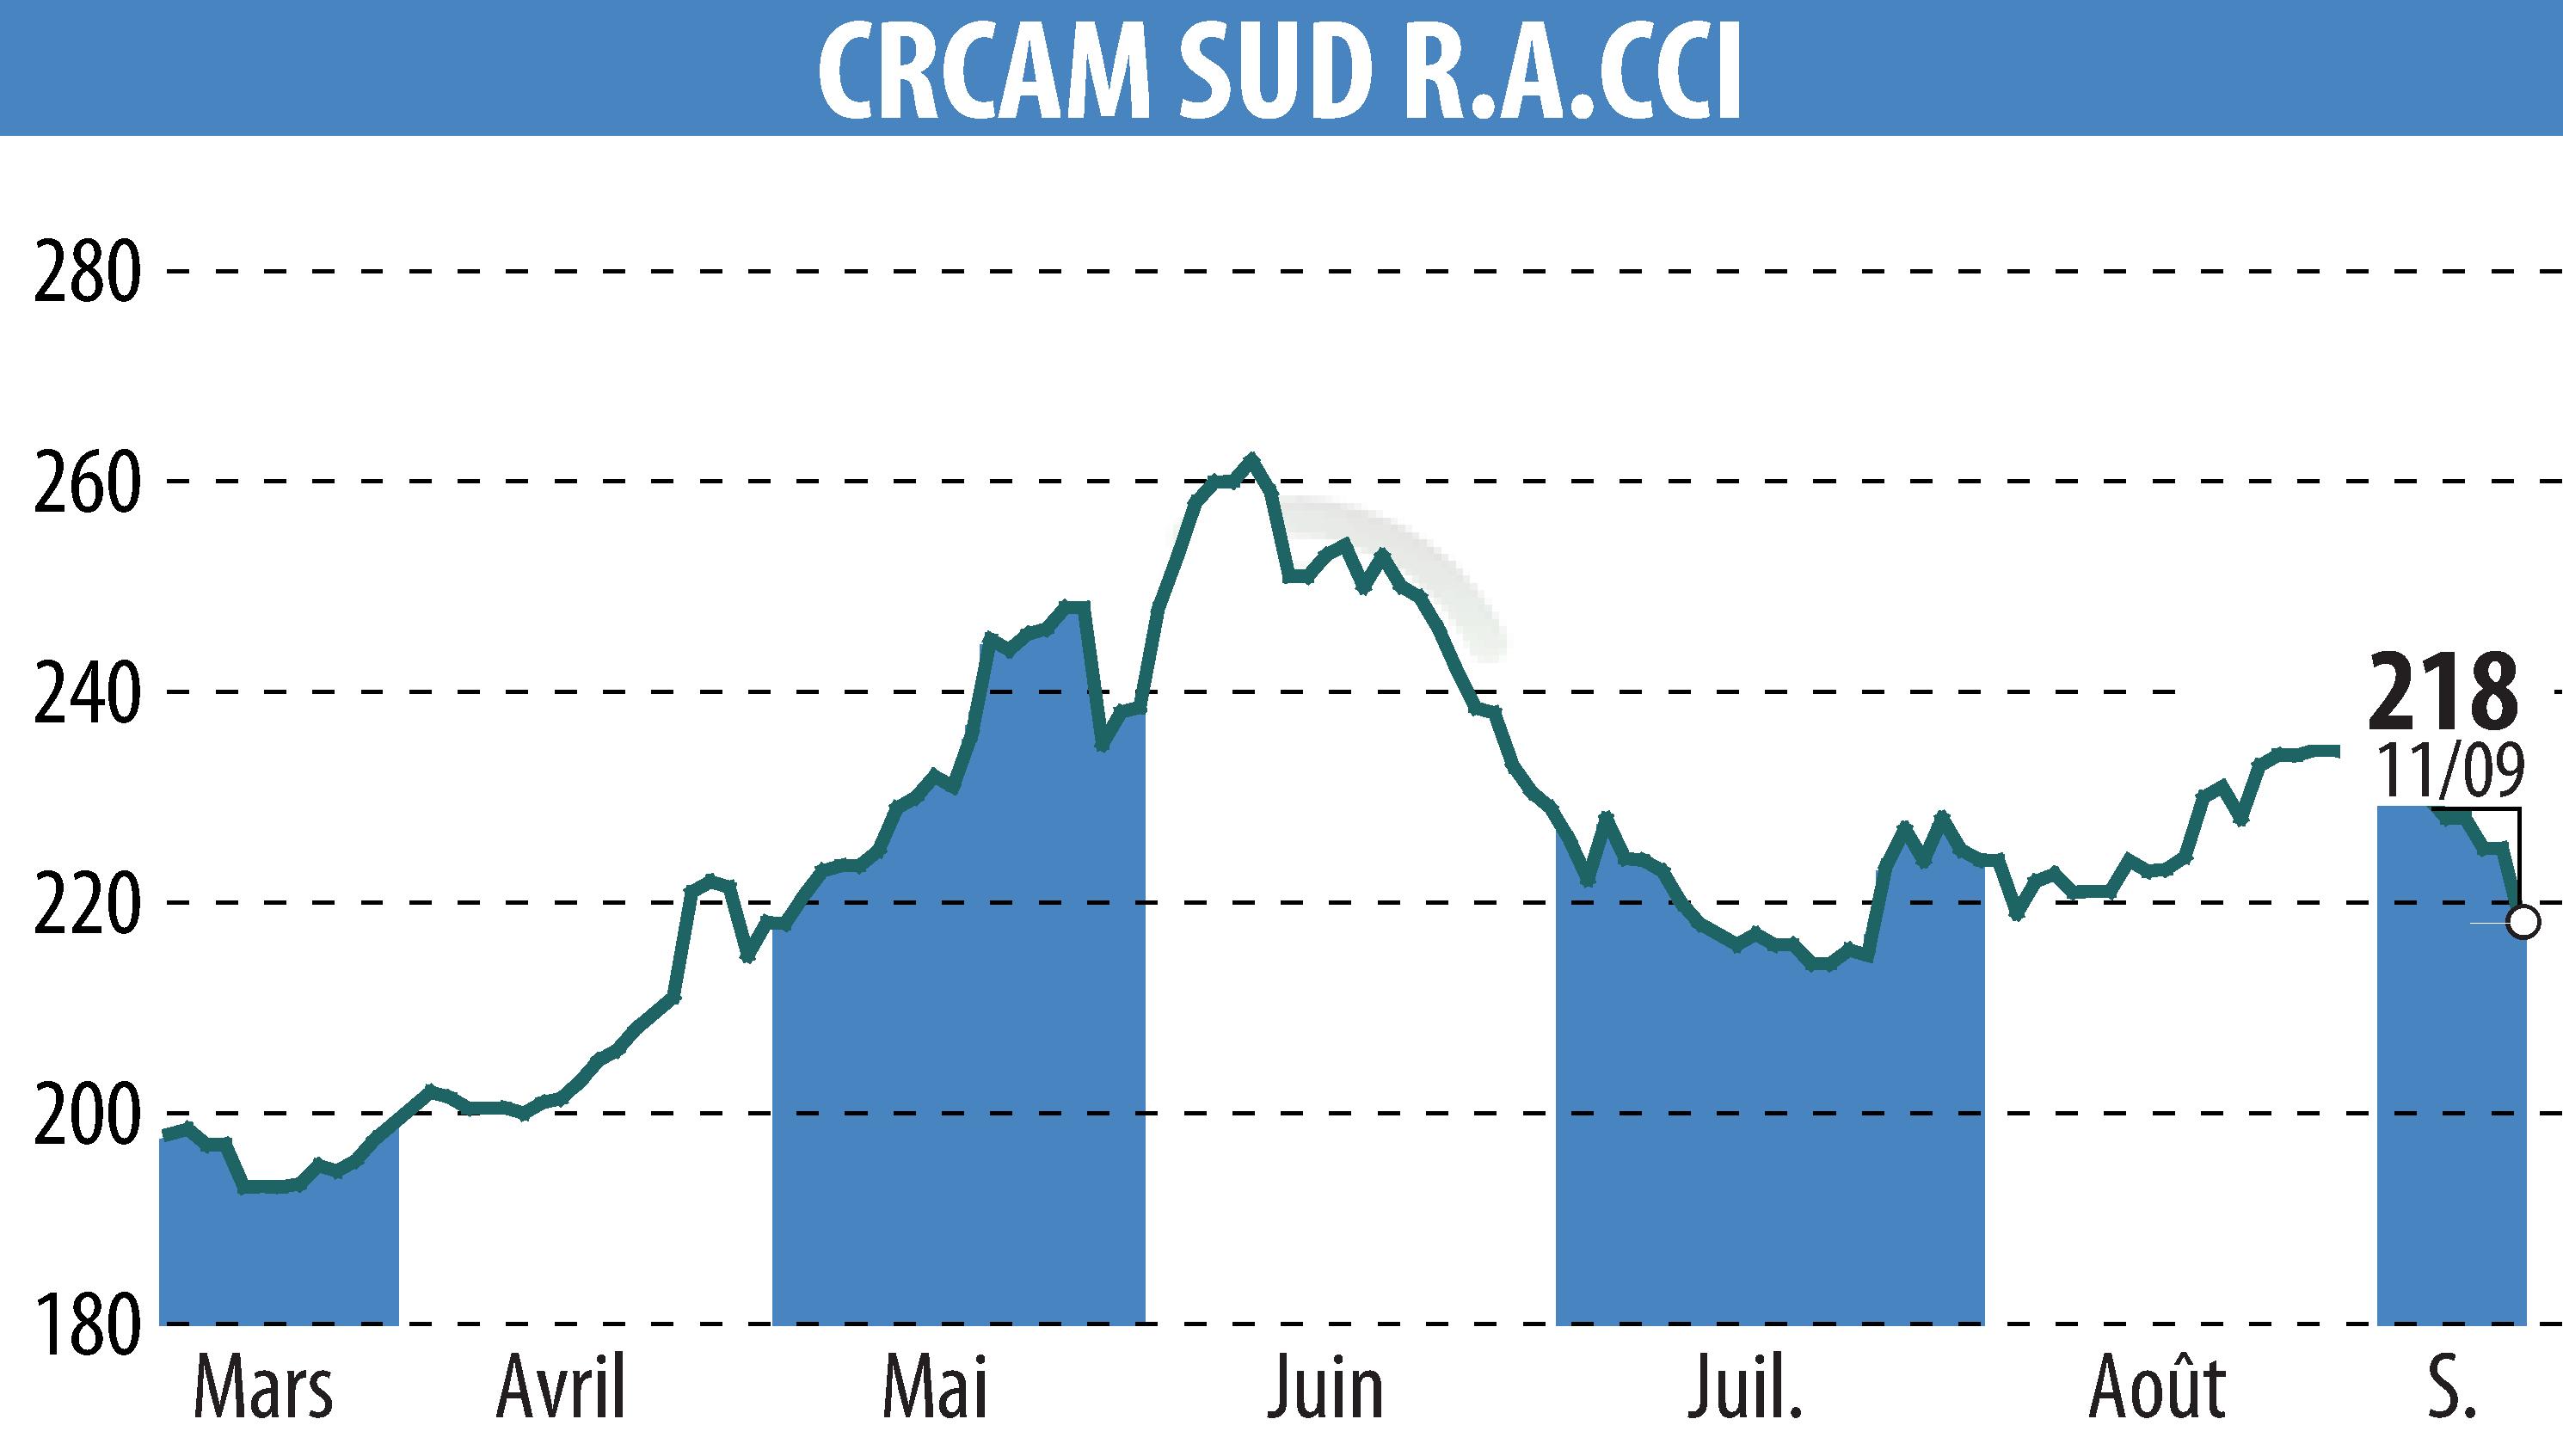
As of June 30, 2026, the Caisse Régionale de Crédit Agricole Mutuel Sud Rhône Alpes published its main financial indicators in accordance with Pillar III. Among the key elements, the Tier 1 capital ratio stands at 22.73%, while the overall capital ratio reaches 23.07%. These ratios exceed the minimum regulatory requirements.
In terms of liquidity, the Liquidity Coverage Ratio (LCR) stands at 111.26%, reflecting a strong ability to meet short-term obligations. Furthermore, the Net Stable Funding Ratio (NSFR) is 104.28%, indicating a balanced, longer-term funding structure.
The institution's total equity amounts to €1,907,189 thousand, and its total risk exposure is reported at €8,266,210 thousand. The leverage ratio stands at 7.76%, reflecting prudent management of assets and liabilities.
R. P.
Copyright © 2026 FinanzWire, tous droits de reproduction et de représentation réservés.
Clause de non responsabilité : bien que puisées aux meilleures sources, les informations et analyses diffusées par FinanzWire sont fournies à titre indicatif et ne constituent en aucune manière une incitation à prendre position sur les marchés financiers.
Cliquez ici pour consulter le communiqué de presse ayant servi de base à la rédaction de cette brève
Voir toutes les actualités de CREDIT AGRICOLE SUD RHONE ALPES