

par Barton Gold Holdings Limited (ASX:BGD)
Upgraded Tunkillia MRE Validates Optimised Scoping Study
ADELAIDE, AU / ACCESS Newswire / November 10, 2026 / Barton Gold Holdings Limited (ASX:BGD)(FRA:BGD3)(OTC PINK:BGDFF) (Barton or Company) is pleased to announce and upgraded JORC (2012) MRE for gold and silver at its South Australian Tunkillia Gold Project (Tunkillia).
| Comparison within May 2025 OSS pit shells | Units | Mar 2025 | Nov 2026 | Net Change |
| Gold Inventory - Measured | Mt | -- | 5.27 | +5.27 |
| Gold Inventory - Indicated | Mt | 25.00 | 25.25 | +0.25 |
| Gold Inventory - Measured | koz Au | 0 | 151 | +151 |
| Gold Inventory - Measured & Indicated | koz Au | 724 | 822 | +14% |
| All OSS pits - contained gold | koz Au | 1,035 | 1,011 | -2% |
| All OSS pits - average grade | g/t Au | 0.82 | 0.83 | +1% |
| S1 + S2 pits - contained gold | koz Au | 365 | 362 | -1% |
| S1 + S2 pits - average grade | g/t Au | 1.05 | 1.06 | +1% |
Tunkillia's May 2025 Optimised Scoping Study (OSS) demonstrated a compelling large-scale gold project with a highly attractive payback profile.[1] Following the OSS, Barton completed nearly 58,000m across 520 drill holes to infill and upgrade mineralisation within the OSS's optimised pit shells in preparation for Tunkillia's PFS.[2]
Commenting on Tunkillia's JORC Resources upgrade, Barton MD Alexander Scanlon said:
"Tunkillia drilling was designed to confirm high confidence in the mineralisation underpinning the robust economics of its May 2025 Optimised Scoping Study, and it has done exactly that with a remarkable consistency to OSS outcomes.
"These results confirm a robust basis for Tunkillia's PFS, and upgrading 151koz Au to ‘Measured' classification provides material support for expedited conversations for project finance, as well as available low dilution funding pathways.
"Finally, I would like to recognise and thank each member of Barton's exploration and field teams. They have delivered an exceptional result despite the many significant challenges of rapidly scaling and upgrading early stage Resources."
[1] Refer to ASX announcement dated 5 May 2025
[2] Refer to ASX announcement dated 6 August 2026
Upgraded Tunkillia JORC Mineral Resources Estimate
All upgrade drilling targeted the infilling of mineralisation contained within Tunkillia's May 2025 OSS pit shells, along with some further extensions of mineralisation in the Southern 223 area previously excluded therefrom.
Tunkillia's upgraded MRE exhibits strong consistency with its prior MRE, especially given that it is now estimated utilising a more conservative methodology which will exclude some of the March 2025 MRE.
A material portion of Tunkillia's MRE which was contained within the OSS ‘S1' pit shell has been converted to JORC ‘Measured' classification (see Fig 1 below). Detailed analysis follows on pages 3 to 6 of this announcement.
Comparison with prior Tunkillia JORC (2012) MRE (Gold Resources)
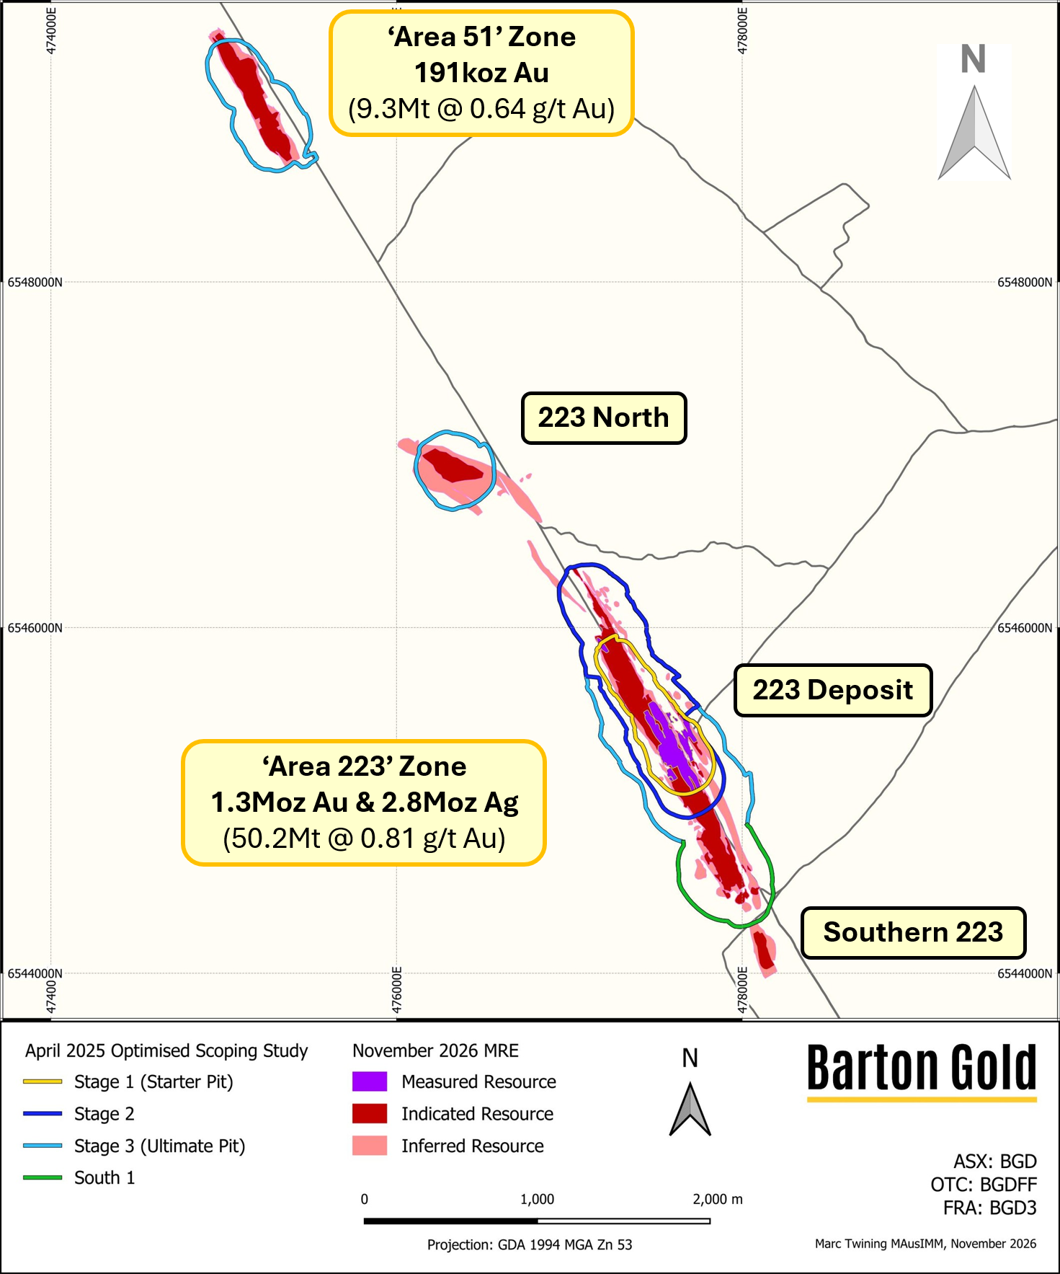
The new Tunkillia gold MRE reflects the Area 51, Area 223N, Area 223 and Southern 223 zones (Figure 1) and:
- the integration of 57,653m new data from 520 reverse circulation (RC) and diamond drilling (DD) holes completed during ‘Phase 1' and ‘Phase 2' upgrade infill drilling undertaken since September 2025;[3] and
- remodelling of Resources on a more conservative basis by constraining mineralisation to an optimised pit shell estimated by applying a revenue factor of 2.0 to the A$3,500/oz optimised pit shell of the OSS.
In effect, this limits the new MRE to only that mineralisation which can be economically mined at a gold price of A$7,000 based on detailed OSS analyses. Remodelling also strongly validates prior Resources modelling, and confirms the May 2025 OSS as a robust foundation for conversion to PFS. Key outcomes:
- within the global MRE include material upgrading of mineralisation to higher categories with:
- strong consistency with the March 2025 MRE reflects a high degree of earlier conservatism; and
- extension of ‘Indicated' mineralisation beyond OSS shells (totalling 6.2Mt and 131koz Au) indicates the potential for optimised pit shells generated during the PFS to extend beyond the OSS pit shells;
- within the OSS pit shells are (note: refer to the following two pages for detailed analysis):
- conversion of >5Mt ‘Inferred' mineralisation to ‘Indicated', and >5Mt ‘Indicated' to ‘Measured', such that 81% of all mineralisation (and 822koz Au) is now ‘Measured' and ‘Indicated' within OSS pit shells;
- highly consistent (± 2%) estimates of contained gold and average grade within the OSS pit shells, and also the S1 / S2 pit shells (as a subset thereof), represents an exceptional validation of OSS results;
- new high-grade mineralisation now classified as ‘Inferred' Resource within shallow areas of ‘S1' and ‘S2' OSS optimised pit shells represents a priority target for conversion to ‘Indicated' Resources.
| Zone | Measured | Indicated | Inferred | TOTAL | ||||||||
Mt | g/t Au | Koz Au | Mt | g/t Au | Koz Au | Mt | g/t Au | Koz Au | Mt | g/t Au | Koz Au | |
| Area 223 | ||||||||||||
| Oxide | 0.01 | 0.98 | 0.3 | 0.03 | 1.17 | 1 | 0.07 | 0.96 | 2 | 0.11 | 1.02 | 4 |
| Transitional | 1.33 | 0.97 | 41 | 3.41 | 0.85 | 93 | 1.77 | 0.76 | 43 | 6.51 | 0.85 | 178 |
| Fresh | 3.96 | 0.86 | 109 | 22.8 | 0.82 | 602 | 16.8 | 0.77 | 417 | 43.6 | 0.81 | 1,128 |
| Area 51 | ||||||||||||
| Oxide | -- | -- | -- | 0.10 | 0.85 | 3 | 0.16 | 0.97 | 5 | 0.26 | 0.92 | 8 |
| Transitional | -- | -- | -- | 0.27 | 0.76 | 7 | 1.10 | 0.50 | 18 | 1.38 | 0.55 | 25 |
| Fresh | -- | -- | -- | 6.43 | 0.64 | 133 | 1.25 | 0.64 | 26 | 7.68 | 0.64 | 158 |
| TOTAL | 5.3 | 0.88 | 151 | 33.0 | 0.79 | 838 | 21.2 | 0.75 | 511 | 59.5 | 0.78 | 1,500 |
* Totals subject to rounding; tonnages are dry metric tonnes; all Mineral Resources classified as ‘Inferred' are approximate; cut-off grades applied are 0.3 g/t Au (Oxide, Transitional and Fresh Zones). Mineral Resources are reported within an optimised pit shell generated by applying a revenue factor of 2.0 to the A$3,500 / ounce optimised pit shell generated from Tunkillia's 5 May 2025 Optimised Scoping Study. | ||||||||||||
Table 1 - Tunkillia Gold JORC (2012) Mineral Resources Estimate (November 2026)
| Zone | Measured | Indicated | Inferred | TOTAL | ||||||||
Mt | g/t Au | Koz Au | Mt | g/t Au | Koz Au | Mt | g/t Au | Koz Au | Mt | g/t Au | Koz Au | |
| Area 223 | ||||||||||||
Oxide | -- | -- | -- | 0.73 | 1.09 | 26 | 0.53 | 0.72 | 12 | 1.26 | 0.93 | 38 |
Transitional | -- | -- | -- | 3.13 | 1.07 | 108 | 3.70 | 0.77 | 92 | 6.83 | 0.91 | 200 |
Fresh | -- | -- | -- | 25.6 | 0.89 | 733 | 20.7 | 0.72 | 479 | 46.3 | 0.81 | 1,212 |
| Area 51 | ||||||||||||